Edit chart
Loading graph
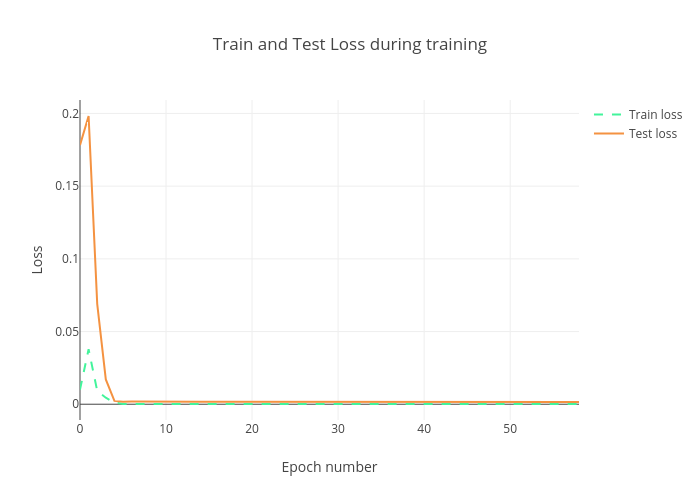
Ibobriakov's interactive graph and data of "Train and Test Loss during training" is a line chart, showing Train loss vs Test loss; with Epoch number in the x-axis and Loss in the y-axis.. The x-axis shows values from 0 to 58. The y-axis shows values from -0.0108512116833309 to 0.2092498575021551.