Edit chart
Loading graph
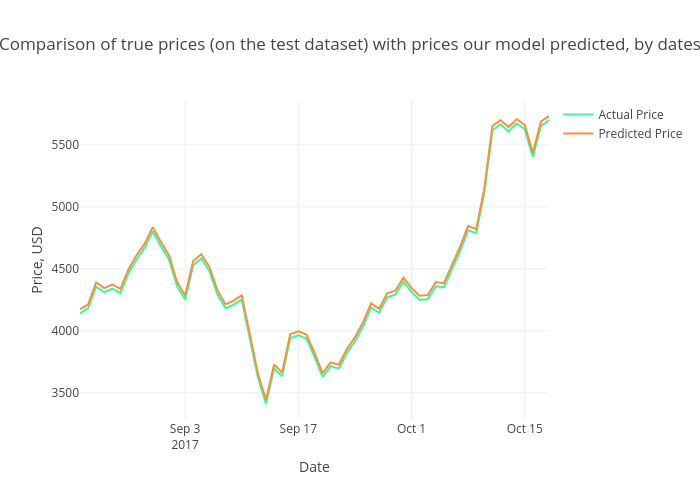
Ibobriakov's interactive graph and data of "Comparison of true prices (on the test dataset) with prices our model predicted, by dates" is a scatter chart, showing Actual Price vs Predicted Price; with Date in the x-axis and Price, USD in the y-axis.. The x-axis shows values from 2017-08-21 to 2017-10-18. The y-axis shows values from 3279.8125633997747 to 5862.303758998696.