Edit chart
Loading graph
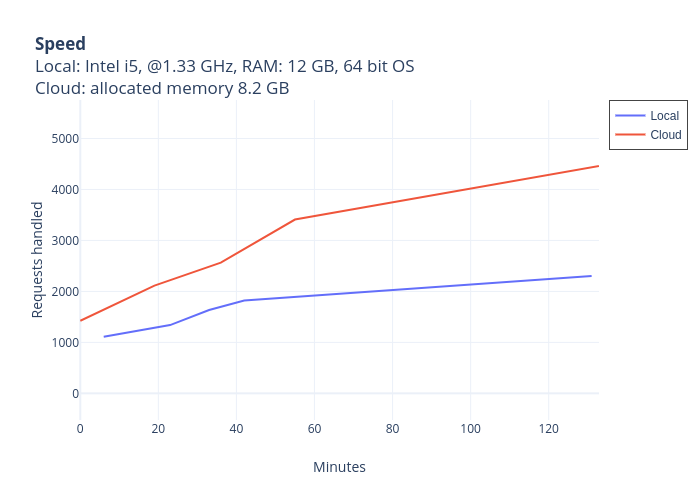
Igorsavinkin's interactive graph and data of "SpeedLocal: Intel i5, @1.33 GHz, RAM: 12 GB, 64 bit OSCloud: allocated memory 8.2 GB" is a line chart, showing Local vs Cloud; with Minutes in the x-axis and Requests handled in the y-axis.. The x-axis shows values from -0.07606837606837757 to 132.89145299145298. The y-axis shows values from -522 to 5754.731145522173.