Edit chart
Loading graph
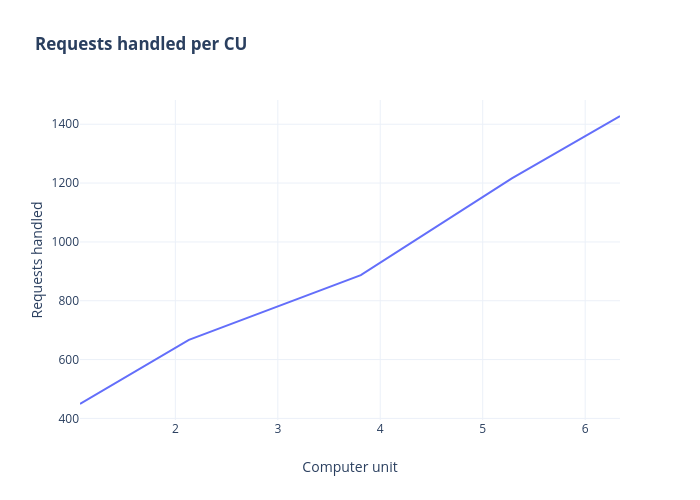
Igorsavinkin's interactive graph and data of "Requests handled per CU" is a line chart, showing %{meta.columnNames.y}; with Computer unit in the x-axis and Requests handled in the y-axis.. The x-axis shows values from 1.069 to 6.34. The y-axis shows values from 394.6111111111111 to 1482.388888888889.