Edit chart
Loading graph
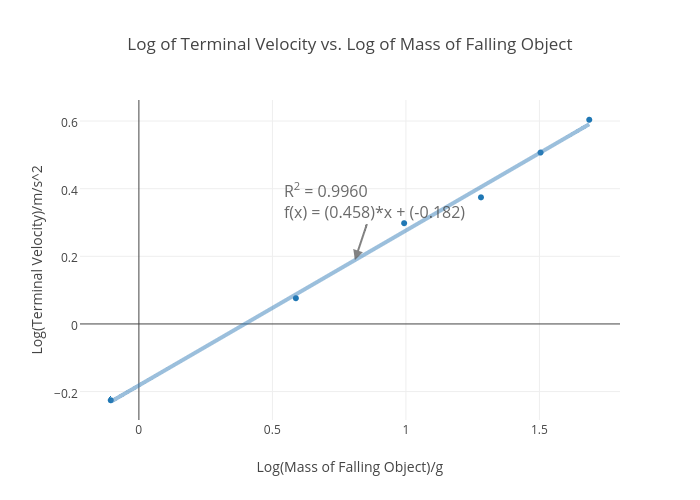
Ihajar's interactive graph and data of "Log of Terminal Velocity vs. Log of Mass of Falling Object" is a scatter chart, showing log(x) vs log(x) - fit; with Log(Mass of Falling Object)/g in the x-axis and Log(Terminal Velocity)/m/s^2 in the y-axis.. The x-axis shows values from -0.2181397021074645 to 1.799178140019867. The y-axis shows values from -0.27704621355754383 to 0.6551689014339442. This visualization has the following annotation: R2 = 0.9960f(x) = (0.458)*x + (-0.182)