Edit chart
Loading graph
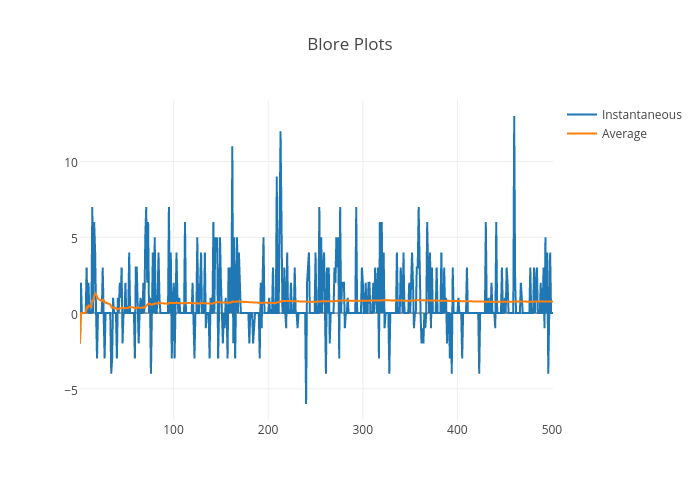
Indiantinker's interactive graph and data of "Blore Plots" is a scatter chart, showing Instantaneous vs Average. The x-axis shows values from 1 to 501. The y-axis shows values from -7.055555555555555 to 14.055555555555555.