Edit chart
Loading graph
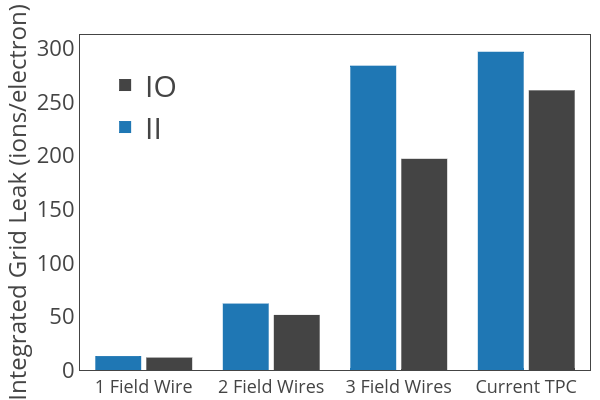
Iraklic's interactive graph and data of "Integrated Grid Leak (ions/electron) vs " is a grouped bar chart, showing II vs IO; with in the x-axis and Integrated Grid Leak (ions/electron) in the y-axis.. The x-axis shows values from -0.5 to 3.5. The y-axis shows values from 0 to 312.63157894736844.