Edit chart
Loading graph
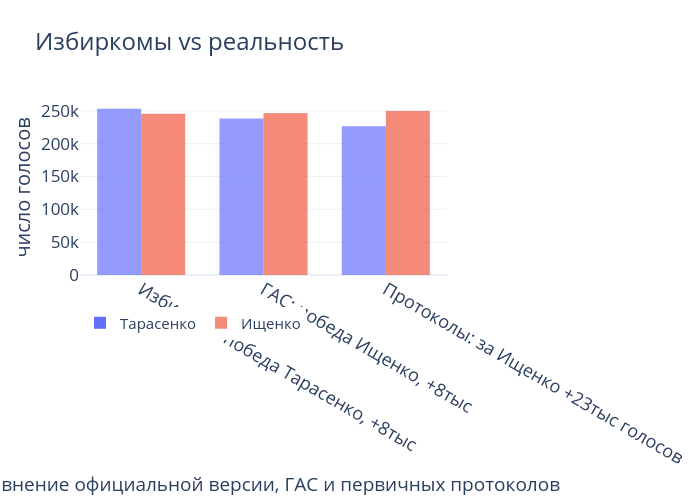
Ishukshin's interactive graph and data of "Избиркомы vs реальность" is a grouped bar chart, showing Тарасенко vs Ищенко; with Сравнение официальной версии, ГАС и первичных протоколов in the x-axis and число голосов in the y-axis.. The x-axis shows values from -0.5 to 2.5. The y-axis shows values from 0 to 266526.3157894737.