Edit chart
Loading graph
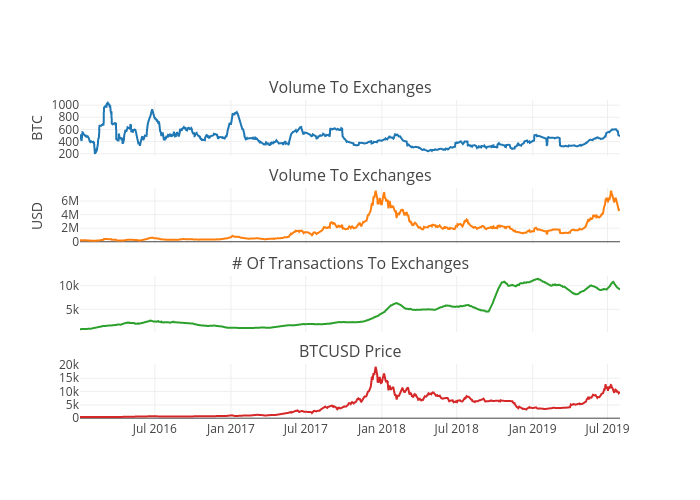
Iwooloowi's interactive graph and data of "Volume sent to exchanges, Volume sent to exchanges, # of Transactions to exchanges, BTC-USD price" is a scatter chart, showing Volume sent to exchanges, Volume sent to exchanges, # of Transactions to exchanges, BTC-USD price; with BTC in the y-axis. The x-axis shows values from 0 to 0. The y-axis shows values from 0 to 0. This visualization has the following annotations: Volume To Exchanges; Volume To Exchanges; # Of Transactions To Exchanges; BTCUSD Price