Edit chart
Loading graph
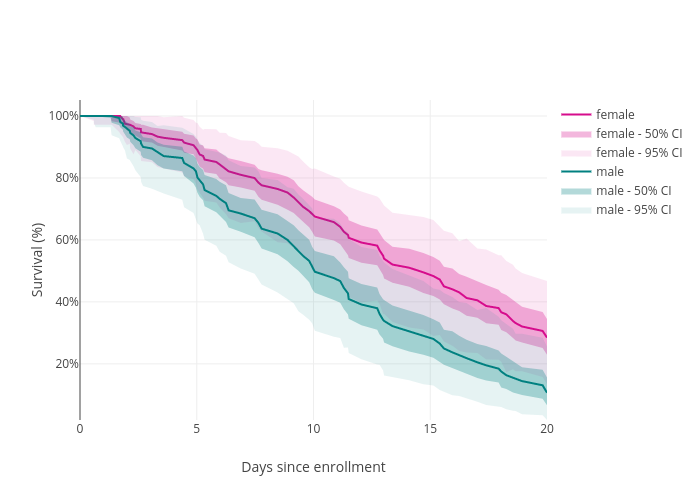
Jackinovik's interactive graph and data of "Survival (%) vs Days since enrollment" is a line chart, showing female, female - 50% CI, female - 95% CI, male, male - 50% CI, male - 95% CI; with Days since enrollment in the x-axis and Survival (%) in the y-axis.. The x-axis shows values from 0 to 0. The y-axis shows values from 0 to 0.