Edit chart
Loading graph
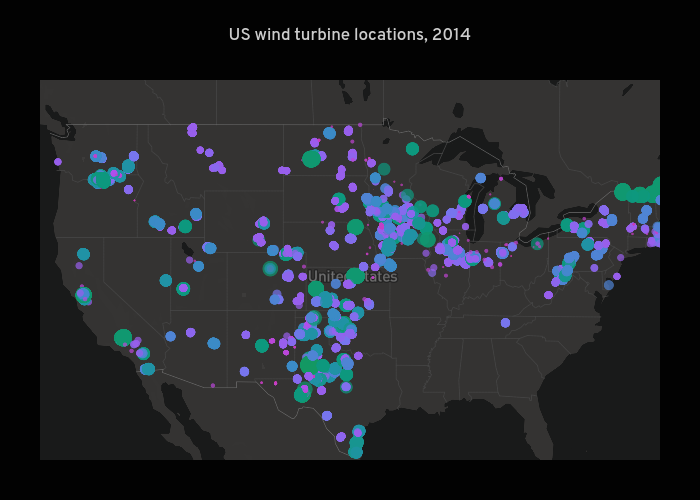
Jackluo's interactive graph and data of "US wind turbine locations, 2014" is a scattermapbox, showing long_DD. The x-axis shows values from 0 to 0. The y-axis shows values from 0 to 0.