Edit chart
Loading graph
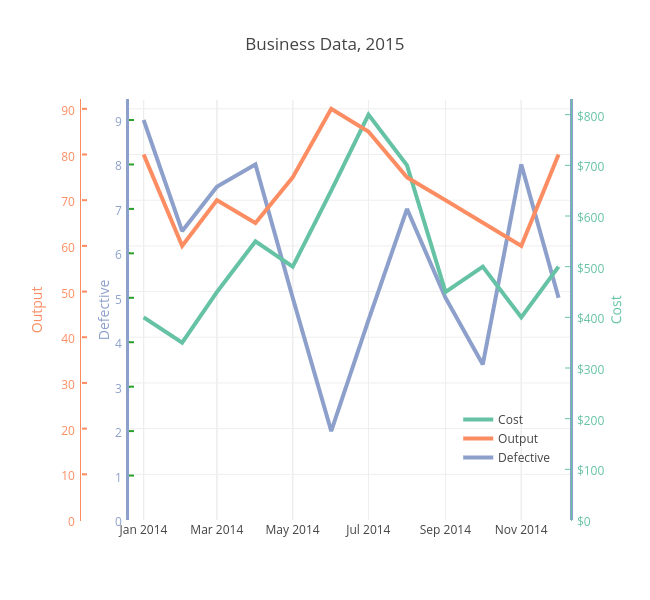
Jackp's interactive graph and data of "Business Data, 2015" is a line chart, showing Cost, Output, Defective; with Defective in the y-axis. The x-axis shows values from 1387515600000 to 1418187600000. The y-axis shows values from 0 to 9.450189155107187.