Edit chart
Loading graph
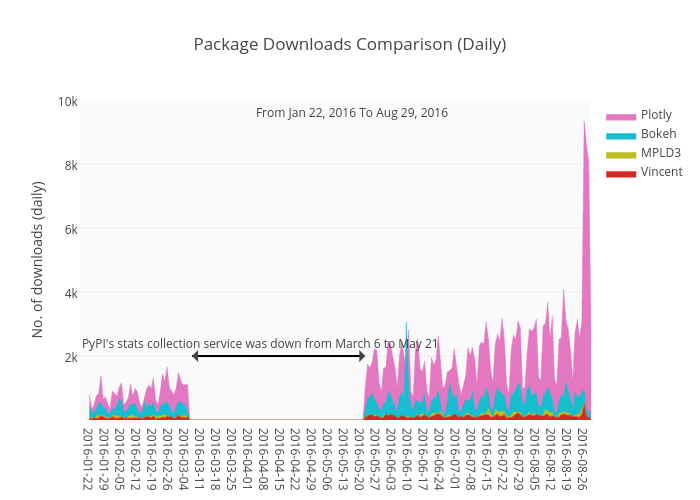
Jackp's interactive graph and data of "Package Downloads Comparison (Daily)" is a filled line chart, showing Plotly, Bokeh, MPLD3, Vincent; with No. of downloads (daily) in the y-axis. The x-axis shows values from 0 to 220. The y-axis shows values from 1 to 10000. This visualization has the following annotations: PyPI's stats collection service was down from March 6 to May 21; From Jan 22, 2016 To Aug 29, 2016