Edit chart
Loading graph
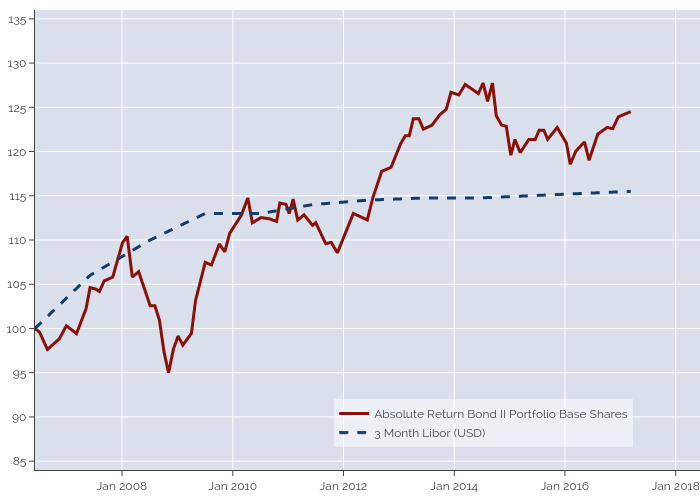
Jackp's interactive graph and data of "Absolute Return Bond II Portfolio Base Shares vs 3 Month Libor (USD)" is a line chart, showing Absolute Return Bond II Portfolio Base Shares vs 3 Month Libor (USD). The x-axis shows values from 2006-06-06 to 2018-06-10. The y-axis shows values from 84 to 136.