Edit chart
Loading graph
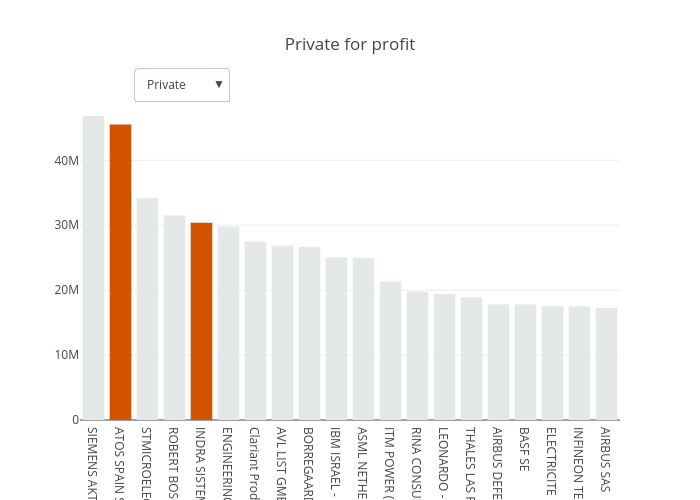
Jairobbva's interactive graph and data of "Private for profit" is a bar chart. The x-axis shows values from -0.5 to 19.5. The y-axis shows values from 0 to 49302184.17894738.