Edit chart
Loading graph
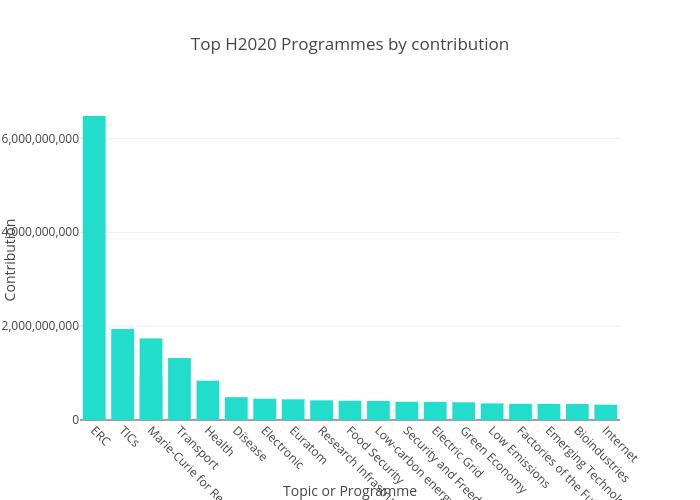
Jairobbva's interactive graph and data of "Top H2020 Programmes by contribution" is a bar chart, showing ecMaxContribution; with Topic or Programme in the x-axis and Contribution in the y-axis.. The x-axis shows values from -0.5 to 18.5. The y-axis shows values from 0 to 6818513783.105265.