Edit chart
Loading graph
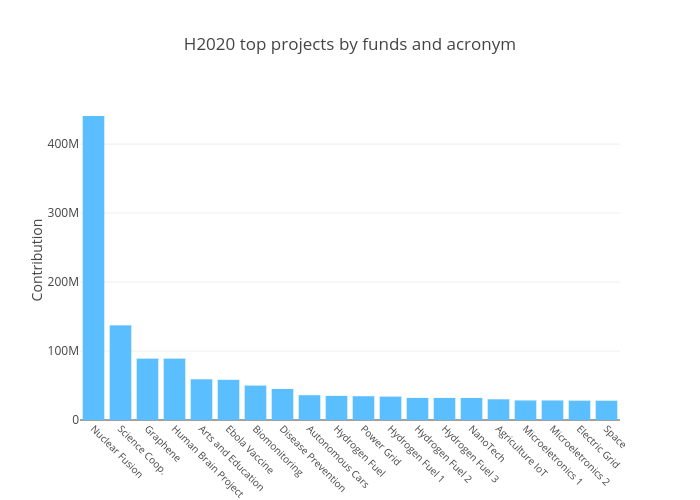
Jairobbva's interactive graph and data of "H2020 top projects by funds and acronym" is a bar chart, showing B; with in the x-axis and Contribution in the y-axis.. The x-axis shows values from -0.5 to 19.5. The y-axis shows values from 0 to 464000000.