Edit chart
Loading graph
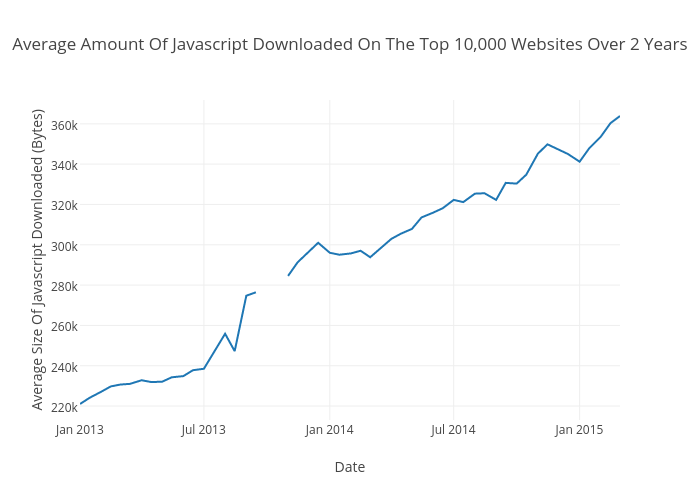
Jakechampion's interactive graph and data of "Average Amount Of Javascript Downloaded On The Top 10,000 Websites Over 2 Years" is a scatter chart, showing avg_bytes_js; with Date in the x-axis and Average Size Of Javascript Downloaded (Bytes) in the y-axis.. The x-axis shows values from 1356998400000 to 1425168000000. The y-axis shows values from 213090.65991111108 to 371803.3016888889.