Edit chart
Loading graph
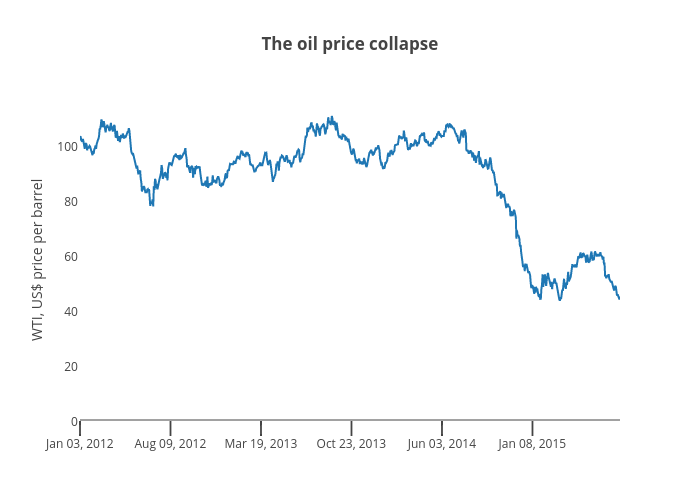
Jasonkirby's interactive graph and data of "The oil price collapse" is a scatter chart, showing WTI, US$ price per barrel; with WTI, US$ price per barrel in the y-axis. The x-axis shows values from 0 to 907. The y-axis shows values from 0 to 116.4421052631579.