Edit chart
Loading graph
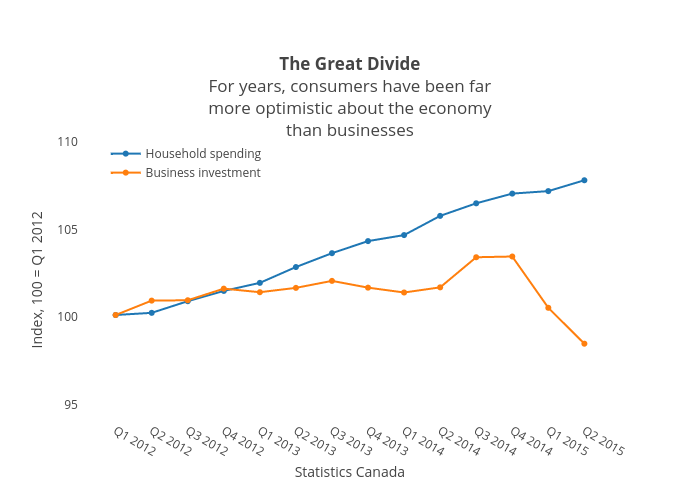
Jasonkirby's interactive graph and data of "The Great DivideFor years, consumers have been farmore optimistic about the economythan businesses" is a scatter chart, showing Household spending vs Business investment; with Statistics Canada in the x-axis and Index, 100 = Q1 2012 in the y-axis.. The x-axis shows values from -0.9878738884397738 to 13.987873888439774. The y-axis shows values from 94 to 110.