Edit chart
Loading graph
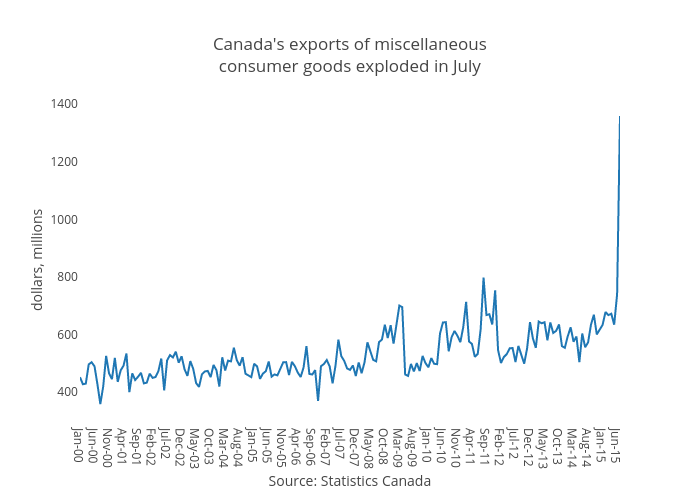
Jasonkirby's interactive graph and data of "Canada's exports of miscellaneousconsumer goods exploded in July" is a scatter chart, showing Exports of miscellaneous consumer goods; with Source: Statistics Canada in the x-axis and dollars, millions in the y-axis.. The x-axis shows values from 0 to 186. The y-axis shows values from 297.5777777777778 to 1408.0222222222221.