Edit chart
Loading graph
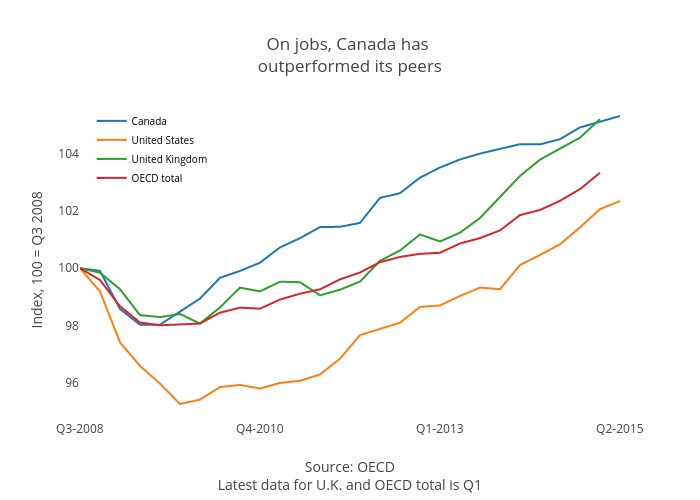
Jasonkirby's interactive graph and data of "On jobs, Canada has outperformed its peers" is a scatter chart, showing Canada, United States, United Kingdom, OECD total; with Source: OECDLatest data for U.K. and OECD total is Q1 in the x-axis and Index, 100 = Q3 2008 in the y-axis.. The x-axis shows values from 0 to 27. The y-axis shows values from 94.68892404611111 to 105.88738252388889.