Edit chart
Loading graph
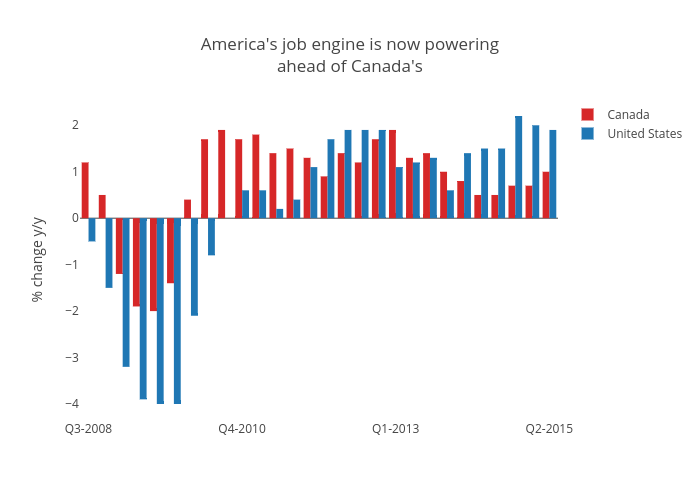
Jasonkirby's interactive graph and data of "America's job engine is now poweringahead of Canada's" is a bar chart, showing Canada vs United States; with % change y/y in the y-axis. The x-axis shows values from -0.5 to 27.5. The y-axis shows values from -4.344444444444445 to 2.5444444444444447.