Edit chart
Loading graph
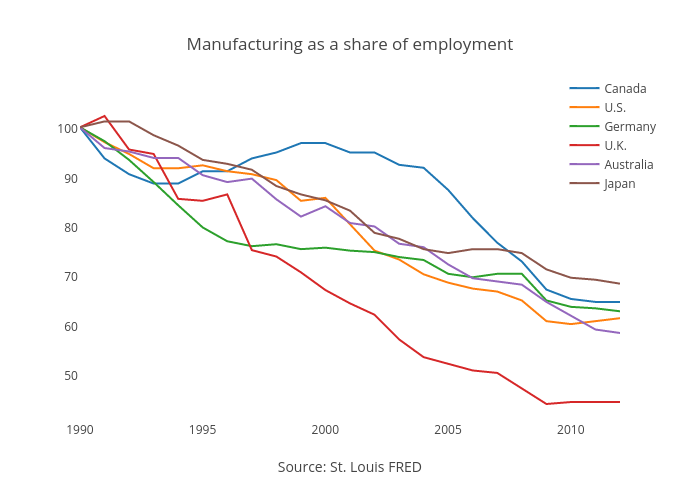
Jasonkirby's interactive graph and data of "Manufacturing as a share of employment" is a scatter chart, showing Canada, U.S., Germany, U.K., Australia, Japan; with Source: St. Louis FRED in the x-axis. The x-axis shows values from 631170000000 to 1325394000000. The y-axis shows values from 40.65555555555555 to 105.54444444444444.