Edit chart
Loading graph
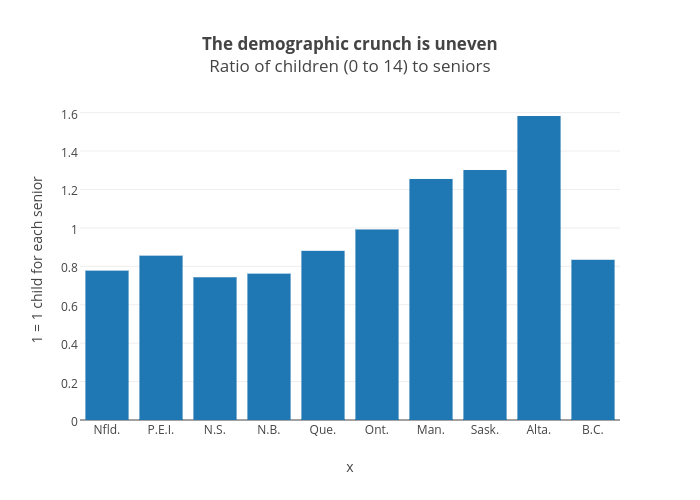
Jasonkirby's interactive graph and data of "The demographic crunch is unevenRatio of children (0 to 14) to seniors" is a bar chart, showing y; with x in the x-axis and 1 = 1 child for each senior in the y-axis.. The x-axis shows values from -0.5 to 9.5. The y-axis shows values from 0 to 1.6656279.