Edit chart
Loading graph
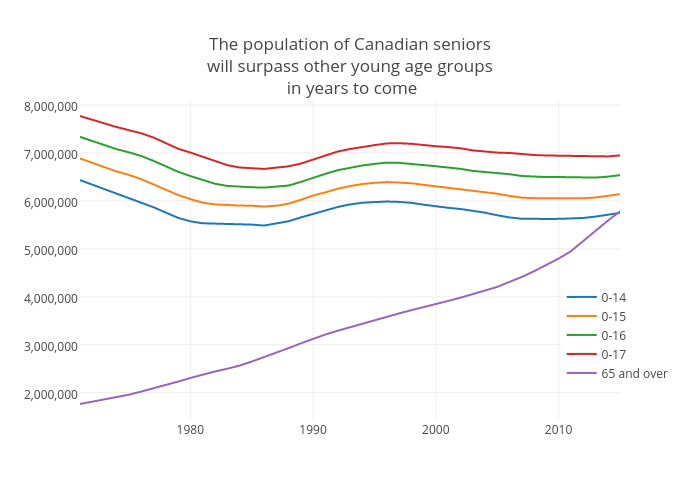
Jasonkirby's interactive graph and data of "The population of Canadian seniorswill surpass other young age groups in years to come" is a scatter chart, showing 0-14, 0-15, 0-16, 0-17, 65 and over. The x-axis shows values from 1971 to 2015. The y-axis shows values from 1428624.9444444445 to 8104326.055555556.