Edit chart
Loading graph
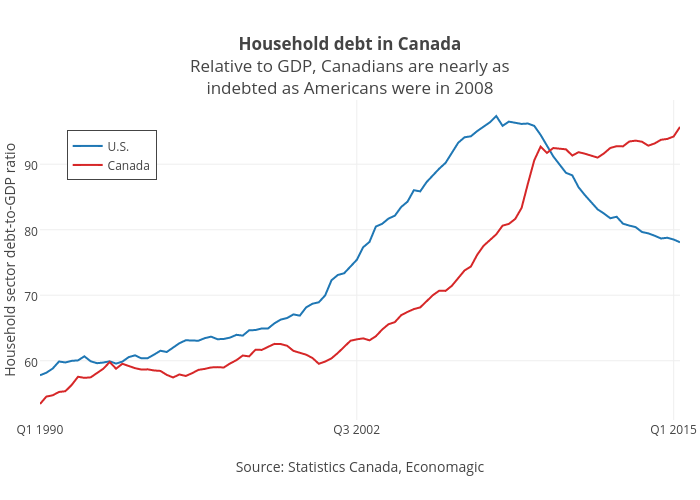
Jasonkirby's interactive graph and data of "Household debt in CanadaRelative to GDP, Canadians are nearly asindebted as Americans were in 2008" is a scatter chart, showing U.S. vs Canada; with Source: Statistics Canada, Economagic in the x-axis and Household sector debt-to-GDP ratio in the y-axis.. The x-axis shows values from 0 to 101. The y-axis shows values from 50.94722222222222 to 99.80277777777778.