Edit chart
Loading graph
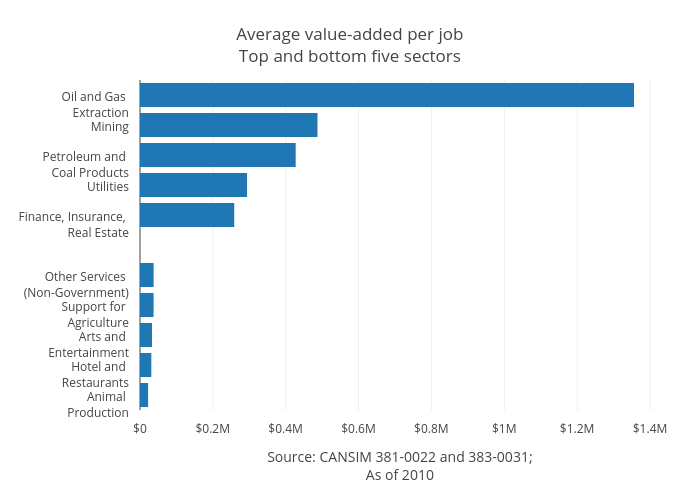
Jasonkirby's interactive graph and data of "Average value-added per jobTop and bottom five sectors" is a bar chart, showing Col2; with Source: CANSIM 381-0022 and 383-0031;As of 2010 in the x-axis. The x-axis shows values from 0 to 1427037.894736842. The y-axis shows values from -0.5 to 10.5.