Edit chart
Loading graph
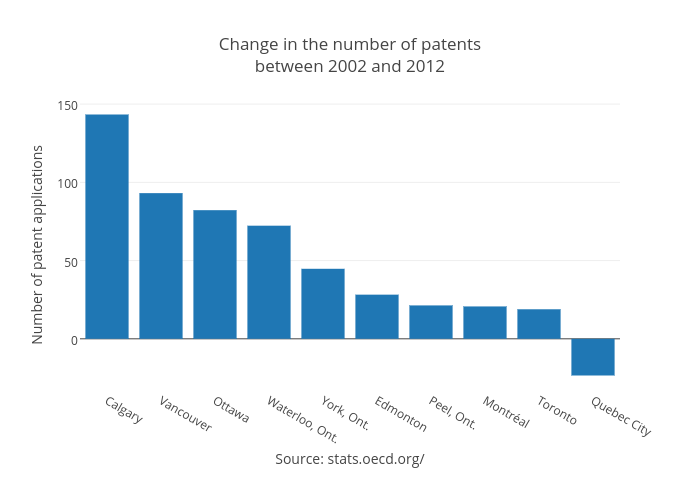
Jasonkirby's interactive graph and data of "Change in the number of patentsbetween 2002 and 2012" is a bar chart, showing 2002-2012; with Source: stats.oecd.org/ in the x-axis and Number of patent applications in the y-axis.. The x-axis shows values from -0.5 to 9.5. The y-axis shows values from -32.723794444444444 to 152.63409444444443.