Edit chart
Loading graph
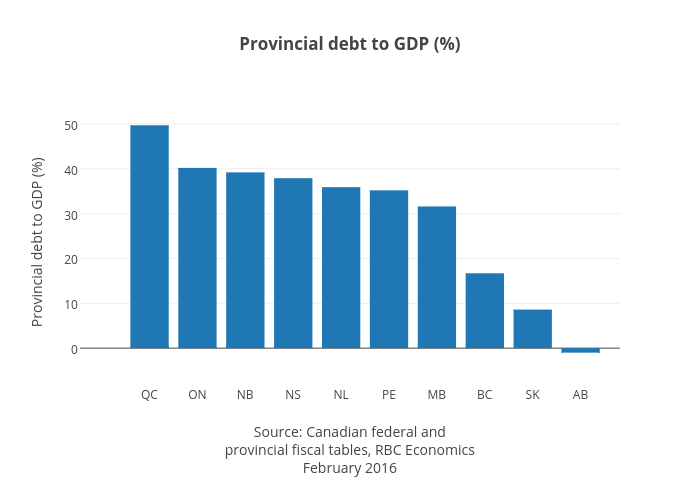
Jasonkirby's interactive graph and data of "Provincial debt to GDP (%)" is a bar chart, showing Provincial debt to GDP; with Source: Canadian federal andprovincial fiscal tables, RBC EconomicsFebruary 2016 in the x-axis and Provincial debt to GDP (%) in the y-axis.. The x-axis shows values from -1.4523945142568762 to 9.822574001536893. The y-axis shows values from -8.175593509628722 to 55.34006246267617.