Edit chart
Loading graph
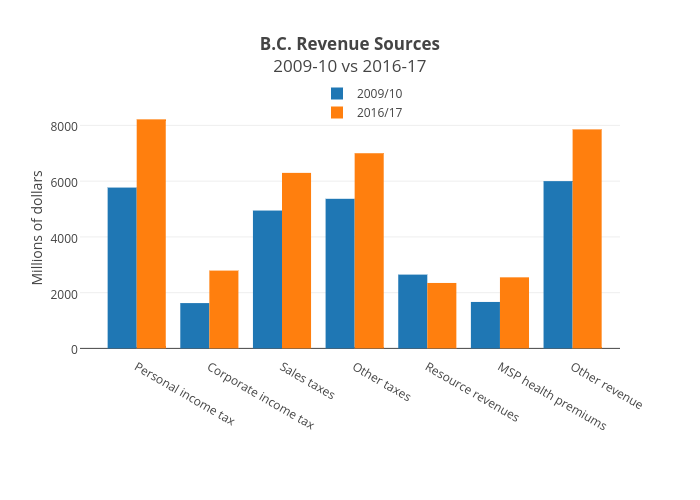
Jasonkirby's interactive graph and data of "B.C. Revenue Sources2009-10 vs 2016-17" is a bar chart, showing 2009/10 vs 2016/17; with Millions of dollars in the y-axis. The x-axis shows values from -0.7803847899154759 to 6.652471035902058. The y-axis shows values from -272.9265402165993 to 8910.283003379933.