Edit chart
Loading graph
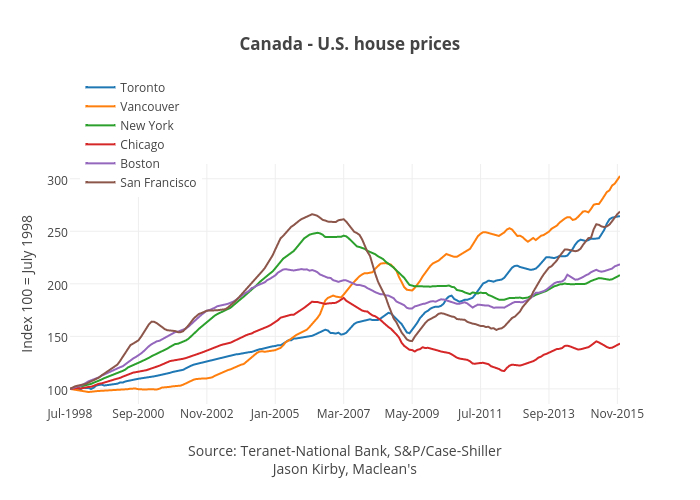
Jasonkirby's interactive graph and data of "Canada - U.S. house prices" is a scatter chart, showing Toronto, Vancouver, New York, Chicago, Boston, San Francisco; with Source: Teranet-National Bank, S&P/Case-ShillerJason Kirby, Maclean's in the x-axis and Index 100 = July 1998 in the y-axis.. The x-axis shows values from 0 to 209. The y-axis shows values from 85.62 to 314.02000000000004.