Edit chart
Loading graph
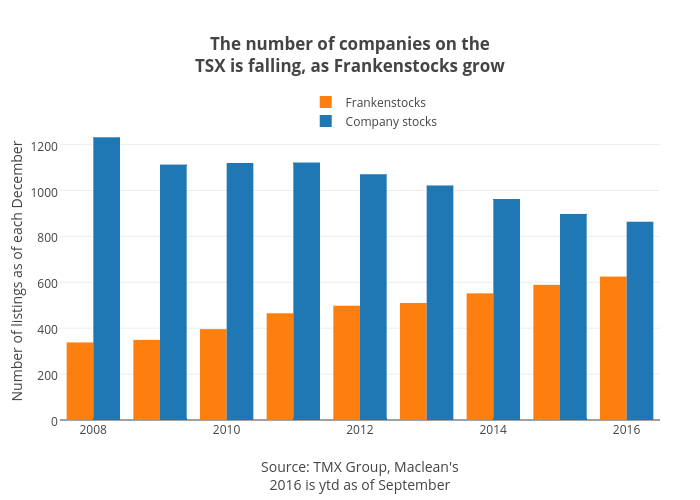
Jasonkirby's interactive graph and data of "The number of companies on theTSX is falling, as Frankenstocks grow" is a grouped bar chart, showing Frankenstocks vs Company stocks; with Source: TMX Group, Maclean's2016 is ytd as of September in the x-axis and Number of listings as of each December in the y-axis.. The x-axis shows values from 2007.5 to 2016.5. The y-axis shows values from 0 to 1296.842105263158.