Edit chart
Loading graph
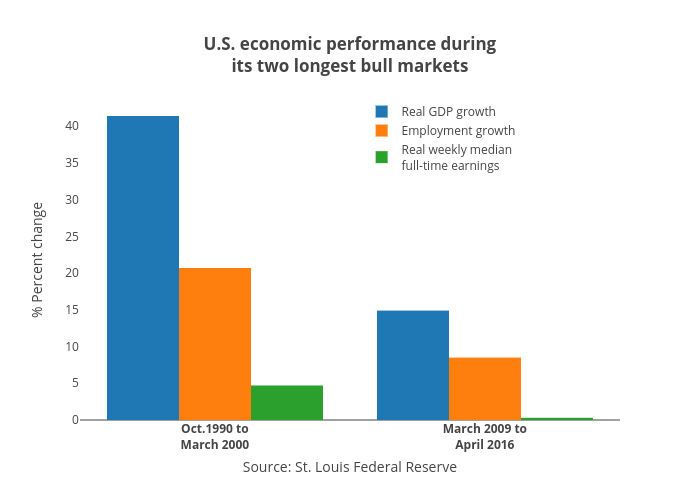
Jasonkirby's interactive graph and data of "U.S. economic performance duringits two longest bull markets" is a bar chart, showing Real GDP growth, Employment growth, Real weekly medianfull-time earnings; with Source: St. Louis Federal Reserve in the x-axis and % Percent change in the y-axis.. The x-axis shows values from -0.5 to 1.5. The y-axis shows values from 0 to 43.57894736842105.