Edit chart
Loading graph
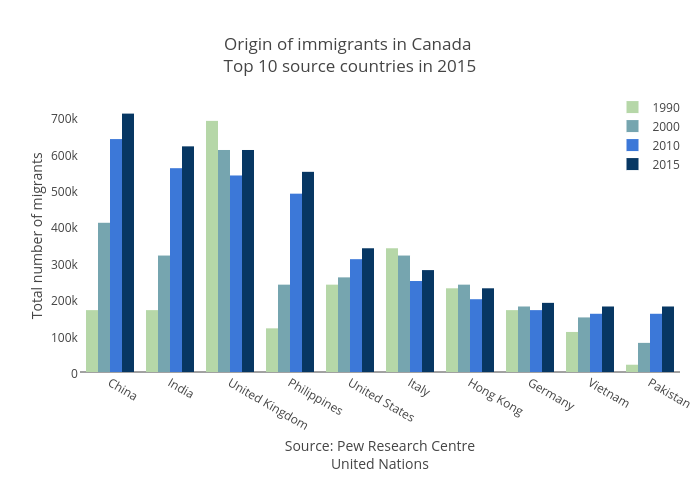
Jasonkirby's interactive graph and data of "Origin of immigrants in Canada Top 10 source countries in 2015" is a bar chart, showing 1990, 2000, 2010, 2015; with Source: Pew Research CentreUnited Nations in the x-axis and Total number of migrants in the y-axis.. The x-axis shows values from -0.5 to 9.5. The y-axis shows values from 0 to 747368.4210526316.