Edit chart
Loading graph
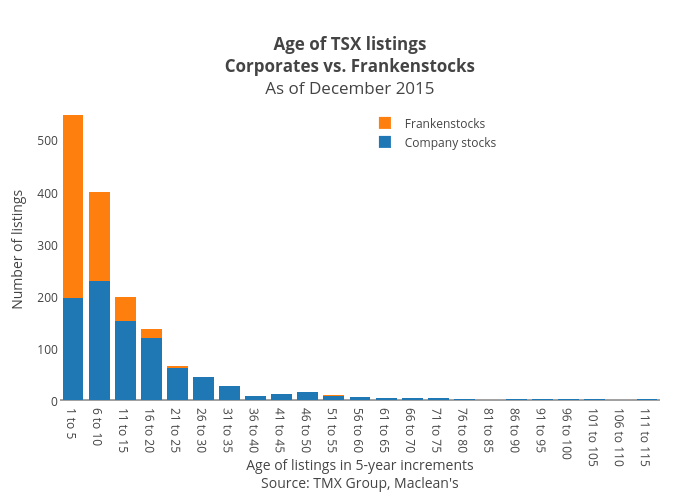
Jasonkirby's interactive graph and data of "Age of TSX listingsCorporates vs. FrankenstocksAs of December 2015" is a stacked bar chart, showing Company stocks vs Frankenstocks; with Age of listings in 5-year incrementsSource: TMX Group, Maclean's in the x-axis and Number of listings in the y-axis.. The x-axis shows values from -0.5 to 22.5. The y-axis shows values from 0 to 575.7894736842105.