Edit chart
Loading graph
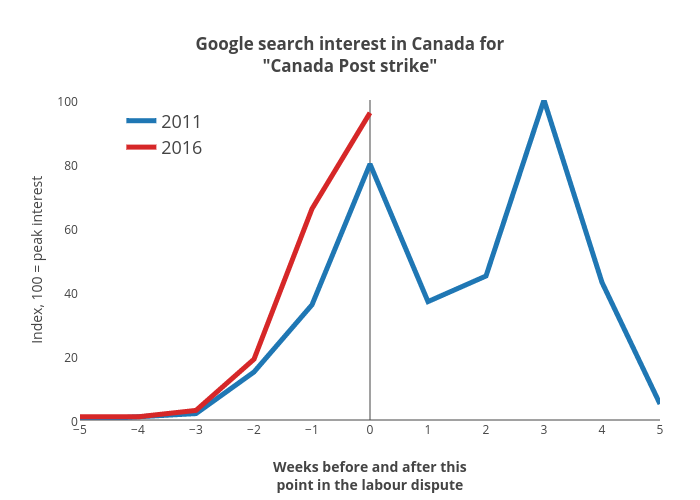
Jasonkirby's interactive graph and data of "Google search interest in Canada for"Canada Post strike"" is a line chart, showing 2011 vs 2016; with Weeks before and after thispoint in the labour dispute in the x-axis and Index, 100 = peak interest in the y-axis.. The x-axis shows values from -5 to 5. The y-axis shows values from 0 to 100.