Edit chart
Loading graph
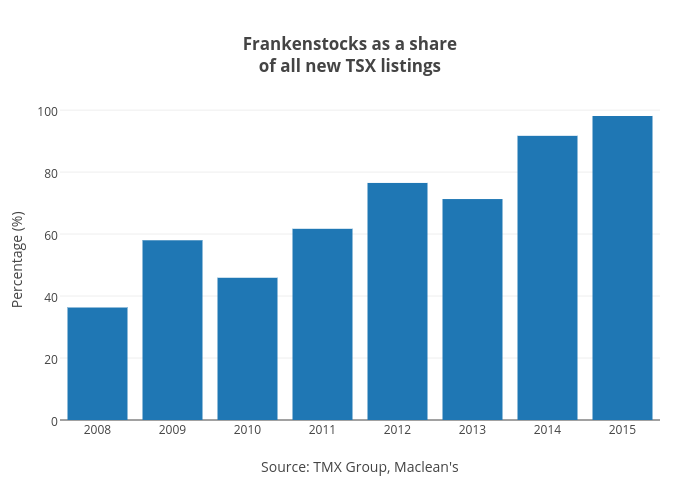
Jasonkirby's interactive graph and data of "Frankenstocks as a shareof all new TSX listings" is a bar chart, showing Col2; with Source: TMX Group, Maclean's in the x-axis and Percentage (%) in the y-axis.. The x-axis shows values from 2007.5 to 2015.5. The y-axis shows values from 0 to 103.26315789473684.