Edit chart
Loading graph
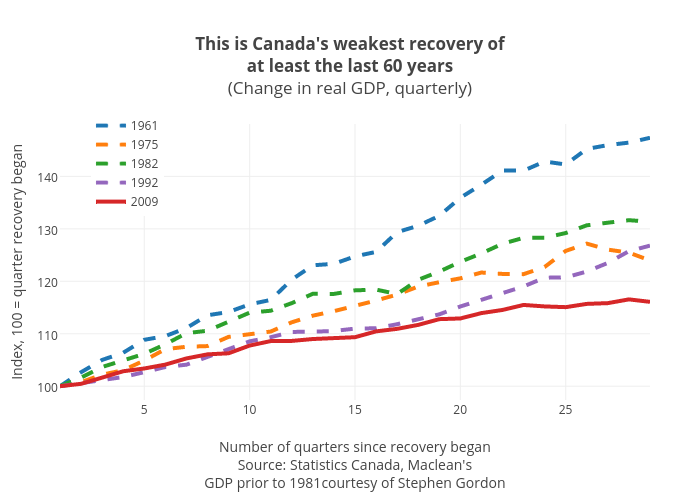
Jasonkirby's interactive graph and data of "This is Canada's weakest recovery ofat least the last 60 years(Change in real GDP, quarterly)" is a line chart, showing 1961, 1975, 1982, 1992, 2009; with Number of quarters since recovery beganSource: Statistics Canada, Maclean'sGDP prior to 1981courtesy of Stephen Gordon in the x-axis and Index, 100 = quarter recovery began in the y-axis.. The x-axis shows values from 1 to 29. The y-axis shows values from 97.36910427777778 to 149.98701872222222.