Edit chart
Loading graph
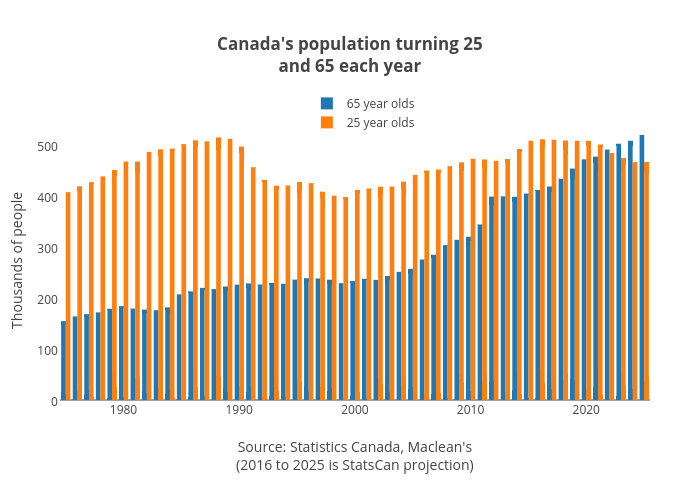
Jasonkirby's interactive graph and data of "Canada's population turning 25and 65 each year" is a bar chart, showing 65 year olds vs 25 year olds; with Source: Statistics Canada, Maclean's(2016 to 2025 is StatsCan projection) in the x-axis and Thousands of people in the y-axis.. The x-axis shows values from 1974.5 to 2025.5. The y-axis shows values from 0 to 546.8421052631579.