Edit chart
Loading graph
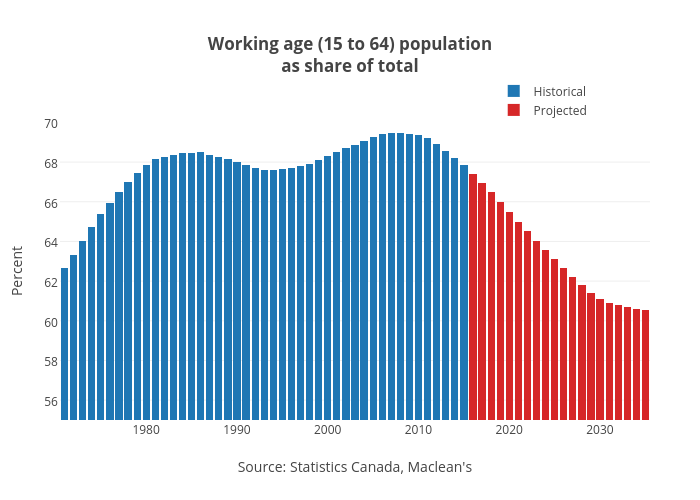
Jasonkirby's interactive graph and data of "Working age (15 to 64) populationas share of total" is a stacked bar chart, showing Historical vs Projected; with Source: Statistics Canada, Maclean's in the x-axis and Percent in the y-axis.. The x-axis shows values from 1970.5 to 2035.5. The y-axis shows values from 55 to 70.