Edit chart
Loading graph
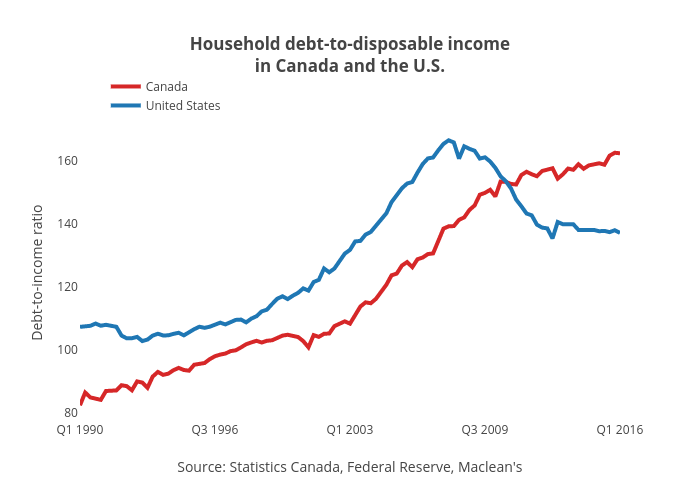
Jasonkirby's interactive graph and data of "Household debt-to-disposable incomein Canada and the U.S." is a line chart, showing Canada vs United States; with Source: Statistics Canada, Federal Reserve, Maclean's in the x-axis and Debt-to-income ratio in the y-axis.. The x-axis shows values from 0 to 104. The y-axis shows values from 77.21861595555555 to 170.44629684444445.