Edit chart
Loading graph
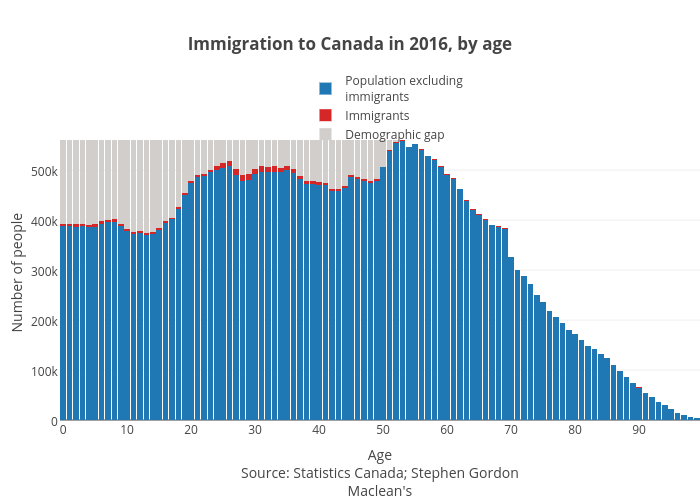
Jasonkirby's interactive graph and data of "Immigration to Canada in 2016, by age" is a stacked bar chart, showing Population excludingimmigrants, Immigrants, Demographic gap; with AgeSource: Statistics Canada; Stephen GordonMaclean's in the x-axis and Number of people in the y-axis.. The x-axis shows values from -0.5 to 99.5. The y-axis shows values from 0 to 589157.8947368421.