Edit chart
Loading graph
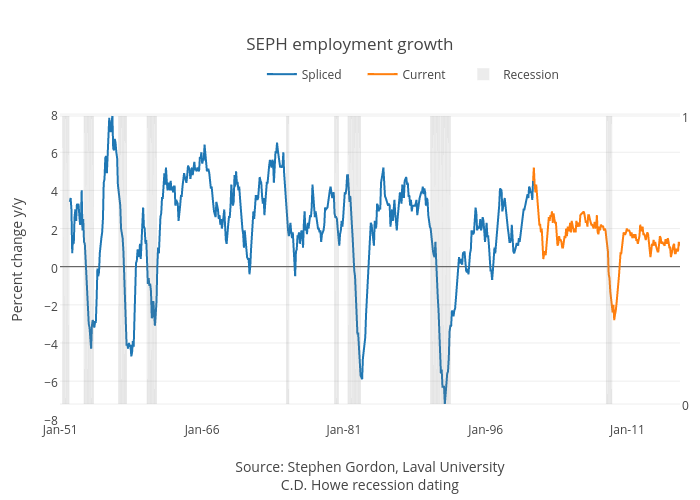
Jasonkirby's interactive graph and data of "SEPH employment growth" is a line chart, showing Spliced, Current, Recession; with Source: Stephen Gordon, Laval UniversityC.D. Howe recession dating in the x-axis and Percent change y/y in the y-axis.. The x-axis shows values from -0.5 to 786.5. The y-axis shows values from -8.03888888888889 to 8.738888888888889.