Edit chart
Loading graph
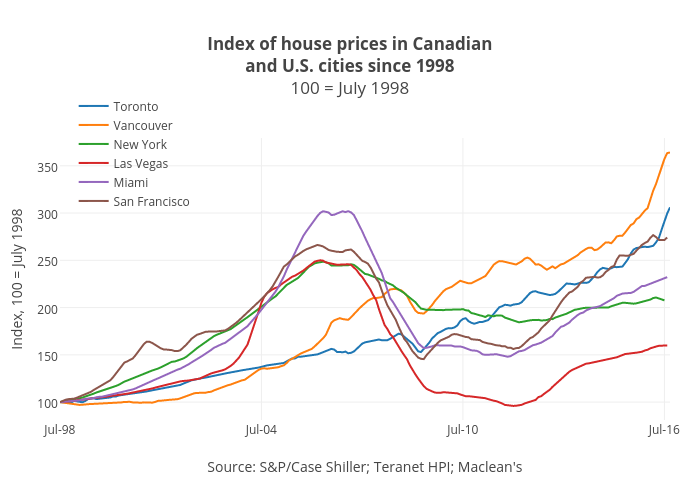
Jasonkirby's interactive graph and data of "Index of house prices in Canadianand U.S. cities since 1998100 = July 1998" is a line chart, showing Toronto, Vancouver, New York, Las Vegas, Miami, San Francisco; with Source: S&P/Case Shiller; Teranet HPI; Maclean's in the x-axis and Index, 100 = July 1998 in the y-axis.. The x-axis shows values from 0 to 218. The y-axis shows values from 81.08762931222222 to 378.9532826677778.