Edit chart
Loading graph
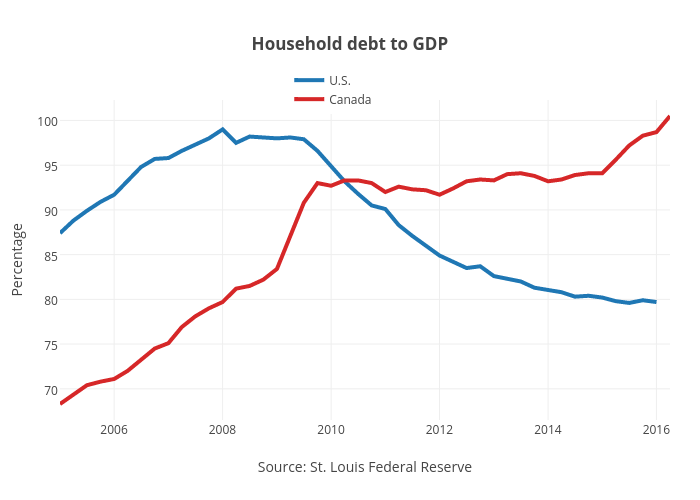
Jasonkirby's interactive graph and data of "Household debt to GDP" is a line chart, showing U.S. vs Canada; with Source: St. Louis Federal Reserve in the x-axis and Percentage in the y-axis.. The x-axis shows values from 1104555600000 to 1459483200000. The y-axis shows values from 66.5111111111111 to 102.28888888888889.