Edit chart
Loading graph
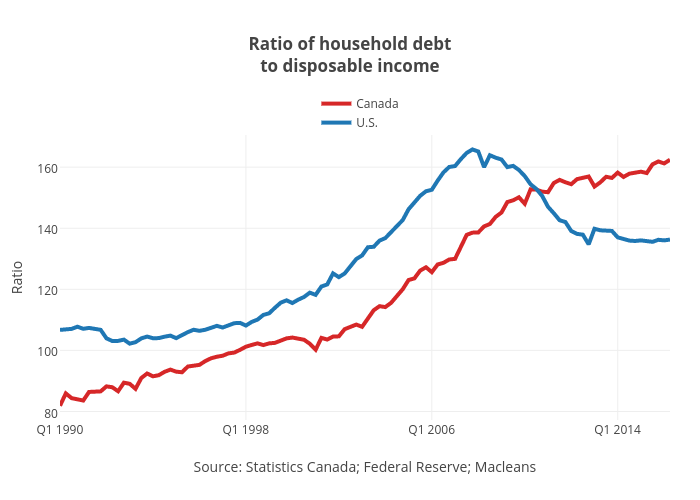
Jasonkirby's interactive graph and data of "Ratio of household debtto disposable income" is a line chart, showing Canada vs U.S.; with Source: Statistics Canada; Federal Reserve; Macleans in the x-axis and Ratio in the y-axis.. The x-axis shows values from 0 to 105. The y-axis shows values from 77.21833333333333 to 170.45166666666665.