Edit chart
Loading graph
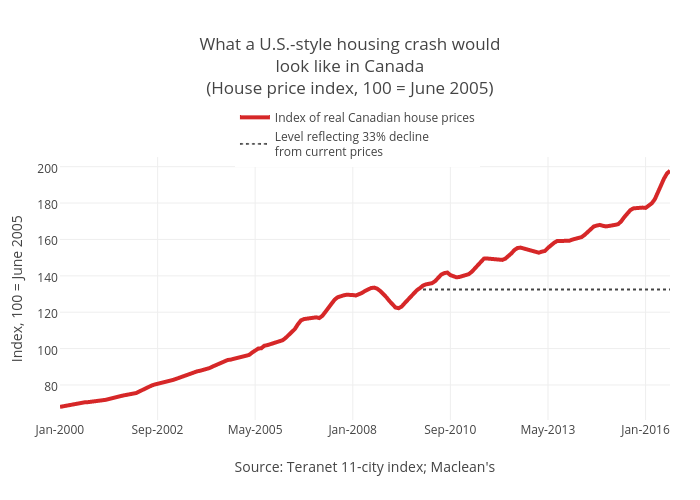
Jasonkirby's interactive graph and data of "What a U.S.-style housing crash wouldlook like in Canada(House price index, 100 = June 2005)" is a line chart, showing Index of real Canadian house prices vs Level reflecting 33% declinefrom current prices; with Source: Teranet 11-city index; Maclean's in the x-axis and Index, 100 = June 2005 in the y-axis.. The x-axis shows values from 0 to 200. The y-axis shows values from 60.72611111111111 to 205.0038888888889.