Edit chart
Loading graph
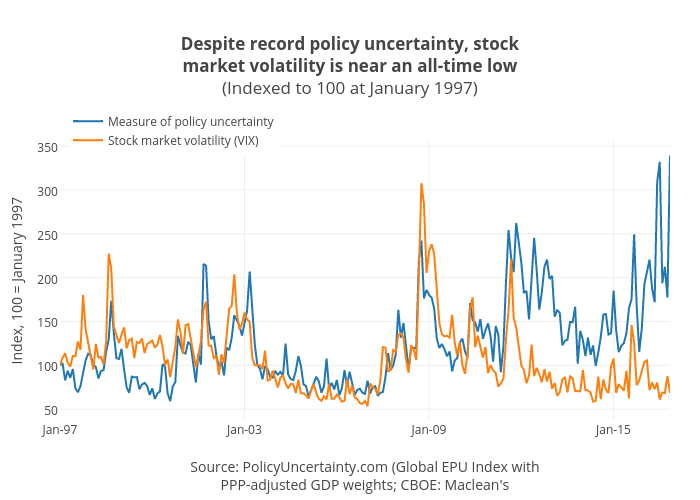
Jasonkirby's interactive graph and data of "Despite record policy uncertainty, stockmarket volatility is near an all-time low(Indexed to 100 at January 1997)" is a line chart, showing Measure of policy uncertainty vs Stock market volatility (VIX); with Source: PolicyUncertainty.com (Global EPU Index withPPP-adjusted GDP weights; CBOE: Maclean's in the x-axis and Index, 100 = January 1997 in the y-axis.. The x-axis shows values from 0 to 238. The y-axis shows values from 37.64893395111111 to 355.0349185288889.