Edit chart
Loading graph
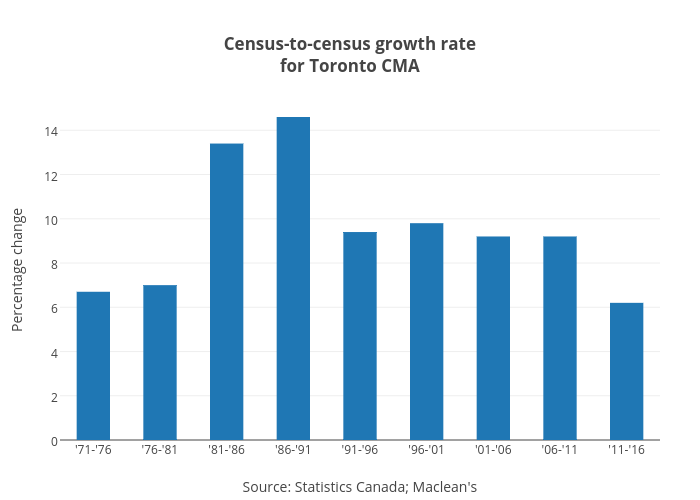
Jasonkirby's interactive graph and data of "Census-to-census growth ratefor Toronto CMA" is a bar chart, showing B; with Source: Statistics Canada; Maclean's in the x-axis and Percentage change in the y-axis.. The x-axis shows values from -0.5 to 8.5. The y-axis shows values from 0 to 15.368421052631579.